! Announcement !
Due to the lack of interactions and tips, new chart posts will have less details to save time and efforts.
Please click on ads or leave a tip to help pay for awesome chart TA!?

I just opened up a crypto account, not sure how it all works though... (click to copy to clipboard)
Paypal: https://www.paypal.com/donate/?hosted_button_id=DJ59RG53BJY9E
Please send me a msg if you would like to tip other crypto.
Message @@NickolasCaskeyDue to the lack of interactions and tips, new chart posts will have less details to save time and efforts.
Please click on ads or leave a tip to help pay for awesome chart TA!?

$TCNNF - Chart Analysis - March 10th, 2022
$TCNNF CHART ANALYSIS
Trulieve Cannabis Corp., much like creeper weed, started selling lightly, but now looks to be producing a high no one wants. Can $TCNNF investors avoid the couch and taking a weed-nap?
Quotes by TradingView
Current Buzz
Trulieve Cannabis Corp. ($TCNNF) is currently on a downtrend, which from the start is clearly picking up pace as we reach a critical volume channel that didn't have much in 2020 and will look to replenish.
The images below is on the weekly and daily comparison, fresh off the press (as of April 3rd/current). Since I made the market prediction (Twitter post below), the stock price seems to behave identical towards my technical analysis. TAKE A HIT OR LET IT SIT?
After a primary correction, the cycle of a downward impulse will continue selling until we reach around 15.77-ish and will act as a small correction, which might give long investors a swing play opportunity if conditions present themselves (could produce $2 gains). With MACD divergence starting on primary correction ('C'), it's likely this divergences will continue through out the 5th wave down.
After a short correction, Trulieve will descend again to low $13 and by that time everyone still holding will likely sell as I still see this ticker selling off until a safe loading zone under $10. *This has potential to hold after the interval 5th wave completes (around $12.70 - $12.30), if that's the case, the correction could be what ends the primary cycle down. An alert at $13 will allow me to revisit this cannabis stock to think correction play. (but will hold first theory to hold true until it doesn't) $TCNNF Update
My last chart analysis was meet with pivot targets confirmed, but with this last few days of trading made me go back to the chart and investigate.
Thursday (May 5th) this cannabis ticker (like a couple other marijuana stocks) sold a little more than what I was expecting. This over sold zone would mean that my last 3rd to 4th correction via primary cycle would need to adjust with this new data. The MACD also confirms, breaking out of divergence, that this is a continuation from the 1st semi-impulse correction. I was targeting $13 for the correction and TCNNF went to $12.77. The oversold data means my daily semi changes the weekly semi, which changes the interval, thus making new primary cycle data points, yay! With the alternation/cycle correction taking place throughout the summer and selling off via 5th wave the rest of year. I believe my last floor for this pot stock was targeting $9, but this new theory makes $7.35 as a start to caught this extra weight and $6.80 - $6.30 as the possible floor for a cycle correction. Pot StocksWriting by Nick CaskeyPot Stocks provides stock chart technical analysis for cannabis investors in the marijuana sector of the stock market(s). Follow PotStocks420 on Twitter! Made or saved money by following these charts? Consider sending a tip or donate towards the analyst's pain management fund.
×
Available Tipping MethodsAvailable Tipping MethodsI just opened up a crypto account, not sure how it all works though... (click to copy to clipboard) Please send me a msg if you would like to tip other crypto. Message @NickolasCaskeyThank you so much in advance!Keep this joint in rotation, pass it along!
Comments
|


Clever Leaves Holding ($CLVR) chart is starting to look like a sherlock pipe ready to get packed, but first let's clear the dirty hits first before producing a new high...
01
Glass House Brands Inc, for the most part, has sustained relatively higher stock price action compared to their competition buds. Is this a paranoia high?
02
Green Thumb Industries Inc has been struggle to get high, despite having higher volume than most cannabis tickers. Will investors get high soon?
03
Curaleaf Holdings Corp. appears to be getting some investors high, but is this a high that will last long or will it become a buzz kill?
04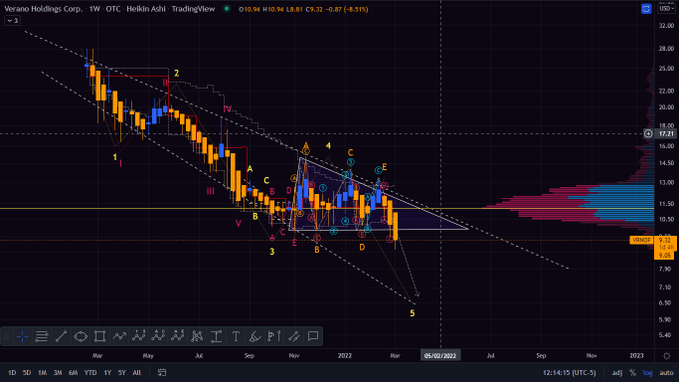
Verano Holdings Corp. has displayed some wacky-tobacky high and low price action, leavening investors in a cerebral haze, can the price soar high as a kite?
05
Columbia Care Inc, following the overall cannabis sector, has been displaying 'Reggie Miller type highs' leaving investors wondering if they will get a playoff buzz.
06
Disclaimer: The information and publications are not meant to be, and do not constitute, financial, investment, trading, or other types of advice or recommendations by Pot Stocks - These are theories and ideas using a chart analysis method developed by Nick Caskey.
 RSS Feed