! Announcement !
Due to the lack of interactions and tips, new chart posts will have less details to save time and efforts.
Please click on ads or leave a tip to help pay for awesome chart TA!?

I just opened up a crypto account, not sure how it all works though... (click to copy to clipboard)
Paypal: https://www.paypal.com/donate/?hosted_button_id=DJ59RG53BJY9E
Please send me a msg if you would like to tip other crypto.
Message @@NickolasCaskeyDue to the lack of interactions and tips, new chart posts will have less details to save time and efforts.
Please click on ads or leave a tip to help pay for awesome chart TA!?

Top Cannabis Stock Plays (Divergence Edition)
Marijuana Stocks Biggest Plays [Divergence Edition]
Top marijuana stocks with the most divergence. Swing play trade ideas with possible divergent correction or reversal in August, 2022.
Divergence occurs when the stock price action happens to do sharp moves that aren't quite calculated within the price action lagging indicators. Using a few indicators, we can spot regular and hidden (or 'counter') divergences that signals continuation on momentum or possible reversal of trend, in which a lot of traders favor the divergence setups and cash in on swing trades. Here are the top 10 cannabis stocks (#potstocks) with the biggest divergence setups for possible swing trades.
Please note that divergence does not confirm anything other than price action 'missteps' and setups wont guarantee a correction or reversals, but notifies that there's a potential for such counter move is available, likely to retrace towards the prices when divergence started to occur.
No short interest data or share float information was taken into consideration, this is strictly based only off minimal waves and focused on divergence. These top 10 pot stocks were chosen because they displayed the most divergences located within the MACD, RSI, Storch RSI, CCI (Commodity Channel Index) and 'Cash Money Flow' (CMF) indicators via weekly timeframe. Let's have a look at these best marijuana stocks with the most divergent setups (no particular order). 1) Tilray Brands, Inc. ($TLRY)
Tilray Brands Inc. ($TLRY) - August Divergence '22
Tilray cannabis stock looks to have already started the reversal. While the ABC has now turned into a 5 wave ('ABCDE') pivot, the MACD has yet to cross over the zero line and displaying smaller histogram columns, which is a little discouraging.
The RSI and CCI appears to have plenty of headroom to continue this momentum while the cash flow indicator hit a new peak last week, which could pivot towards weaker money flow, confirming the weaker MACD histogram... We could see a small correction that could turn this cannabis ticker back into the bears hands if no new money comes back into play. The possibility of sitting in this new channel is also plausible. If bulls can take over, prior the divergent state suggests price reaching $5.37 - $7. Reaching the end of this rally, let's see if new money comes in and continues this momentum for new highs. 2) TPCO Holding Corp. ($GRAMF)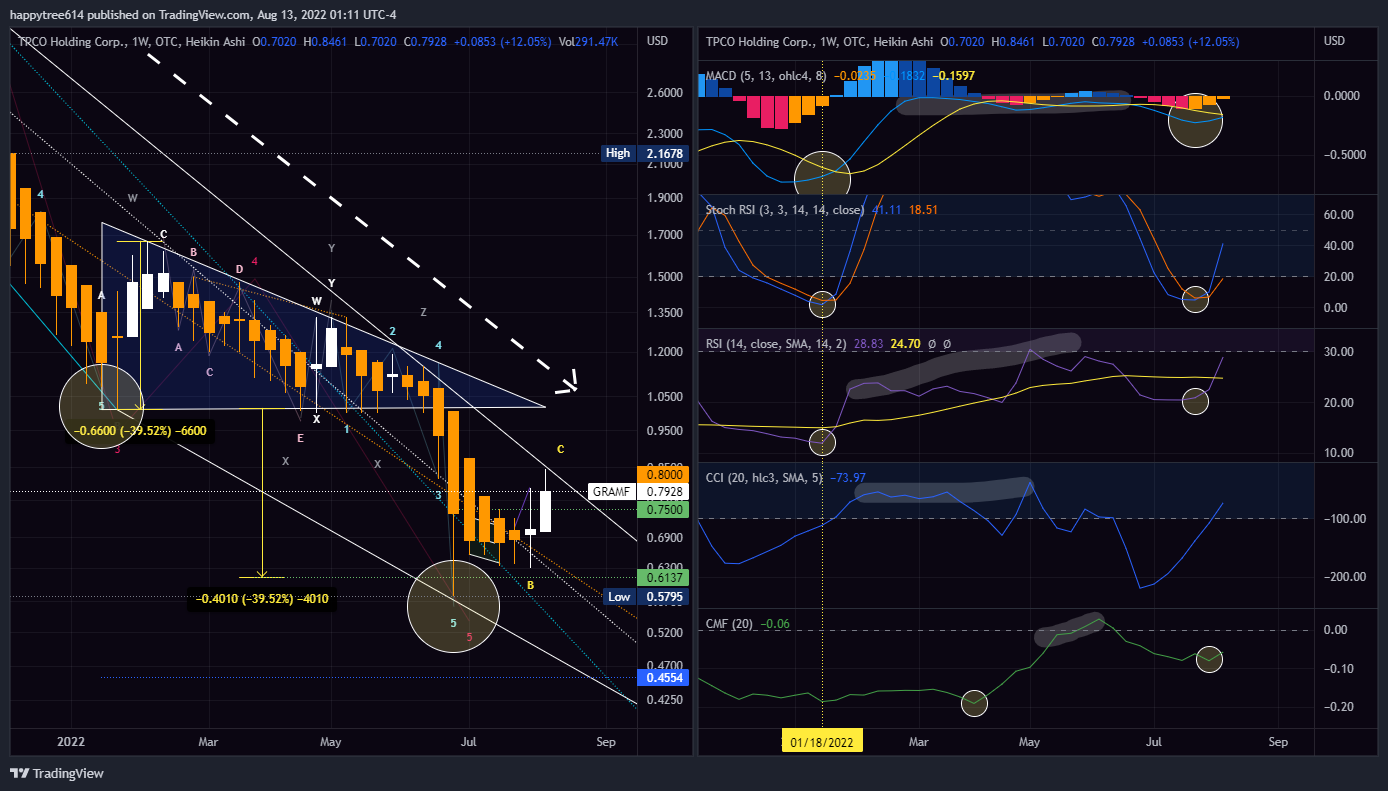
TPCO Holding Corp. ($GRAMF) - August Divergence '22
The amount of divergence smeared over TPCO ($GRAMF) is amazing. This cannabis stock is laced with it from their launch date (Jan. '21) and will be interesting to see just how much is corrected when the marijuana stock sector starts pumping.
The most recent and recognizable divergence begins near the start of Jan. '22 and has yet to show any signs of correcting this (now) 8 month stint. While all, but one indicator, the CCI, showcases multiple divergence states, the CCI does show counter divergence. The stock ticker is currently riding close to a new breakout, one would think with the stock price tag selling under $1 (and share buyback program) compared to other 'MJ stocks' a correction wouldn't be that hard, eh? As much as I cheer for this ticker, I think we might see another sell off which could produce new lows if support isn't found quickly. This could turn into a giant when it wakes up. I have a close eye on this ticker to find out if a new, possibly the first ever bull impulse trend can start producing new highs on the chart. 3) Agrify Corp. ($AGFY)
Agrify Corp. ($AGFY) - August Divergence '22
Agrify is another pot stock that's laced up with divergence. Like $GRAMF, begins in Jan. of this year ('22). And while $AGRF doesn't check all the indicator boxes, the RSI is starting to look real tasty as it does not show any divergence, showing clearing a relative good time to time without it being too much of a risk with the price tag of $1.52 (currently).
The Cash Money Flow indicates big money input end of may and it just died off the last week of August. Maybe investors that were buying finally got exhausted or was it possible shorts sneaking in their covers? This cannabis stock is also tittering on the breakout and could see a reversal. This ticker just set new lows last week, which is discouraging, but at the same time what appears to be on an extension 5th wave and really no extended/alternative pullback, maybe we see this start to get into a channel groove and find support, if not test a bull run soon. 4) Verano Holdings Corp. ($VRNOF)
Verano Holdings Corp. ($VRNOF) - August Divergence '22
Verano Holdings is one of those cannabis stock charts that seem a little bit too easy. If you have been following my posts, $VRNOF has been hitting targets left and right. I might of been the only person to call it (out loud) that this cannabis ticker would see under $6 at the start of the year.
Due to this 3rd wave extension channel (highlighted in white with circled numbers), I would assume $VRNOF isn't far behind the rest of the sector and to test a correction of a cycle (once we established the final 4th to 5th wave down). If you've followed my past posts about this marijuana stock price, I mentioned $4.89 would of been my price target as it sold to $4.75. Now, consider the divergence that started around $7 - $8.50 price action channel, we could see potential 2x-3x reversal. Both Storch RSI and CCI display regular and counter divergence as price action when lower, the indicators made new highs and still hold above previous lows. Cash Money Flow is starting to mark higher highs as price still sells, and the MACD appears to display histogram divergence, which most speculate start/end of cycle of during a correction and lastly, the RSI looks to be settling down and preparing for a take off. I still think it's possible that the 5th wave down sells more so use caution and make sure support has been found before jumping on this crowd favorite. 5) Glass House Brands Inc. ($GLASF)
Glass House Brands ($GLASF) - August Divergence '22
Glass House Brands brings on an oddity of pot stocks divergence and 'counter divergence' as well, for this explanation, this screenshot is in the daily timeframe. With four indicators displaying divergence states, we also show two (likely three) indicators that so other divergence phases (what I like to call counter divergences or "hidden").
This, like $VRNOF has been very spot on when predicting price targets. If you have been following my previous posts about this MJ stock, we've hit all targets within $.05 and as a baseline of support starts to emerge, I look at it will salt in my eyes... The MACD shows signal lines of divergence, but notice the highlighted columns showing a drop in volume momentum. This also being the case when looking at the CCI, showing a higher high and higher low, but the RSI produced a double flat. When you combine that with the CMF signal, if appears to tell the story of investors buying more and more since end of July, but the volume is dropping... is this another case of just shorts sneaking in their covered shares or new investor money coming in and giving shorts a hard time? For me, $2.20-ish needs to show support for any type of bull reversal to happen. 6) Curaleaf Holdings, Inc. ($CULRF)
Curaleaf Holdings Inc. ($CULRF) - August Divergence '22
Curaleaf divergence is a hot-mess. You can see their are waves put in motion by looking at the lagging/delayed responses each indicator beings its' divergent state. While we could have already started the reversal/correction, beginning end of July, it still doesn't take away the fact the $CURLF is on the brink of a new breakout that could ripple another correction or turn this into an actual bull impulse wave.
This Maryjane stock is probably one of, if not the most, oddity of the cannabis sector. While most pot stocks sell hard and show positive and negative regression channels, this one always pointed to being over bought throughout it's downfall. MACD histogram shows last April rally was bigger than this one, but yet that's when most of these indicators start their divergence syncs. So, either everyone loves this ticker and buys no matter what, or something else going on with shorts and their algos. Nonetheless, I fell there might be one more leg down or some support needed to be found above $6.30 for me to trust any of these indicators that each tell something a little different. Watching this one (as always) to see when and how this corrects. 7) GrowGeneration Corp. ($GRWG)
Grow Generation Corp. ($GRWG) - August Divergence '22
Grow Generation Corp is another riddled with divergence and counter divergence states that makes you scratch your head and shrug. It's a 50/50 gamble on this, but it makes you wonder what's in store for the the possible correction or reversal.
I like the indicators all showing higher highs while the stock price still sells with lower lows. But, with the most recent rally can actually be from the May - June (3-4 semi wave down) 'misstep' (how the price action "knifes" and spikes down then up really fast) . The MACD, Storch, RSI, and CMF all agree that the weekly divergence started end on January, while the RSI and CCI both register the same divergent of the MACD histogram... Making me think if a reversal is to take place, it should meet the same price action close to when all it started, likely around $7.33 on the low side and $10.10 on the high side. If breakout fails, I would wait to retest somewhere around $4.20 - $3.40 to see if more support can give it another chance. 8) Planet 13 Holdings, Inc. ($PLNHF)
Planet 13 Holdings ($PLNHF) - August Divergence '22
Planet 13 Holdings stock meets a whole heap of regular and counter divergence. While the marker is set around the end of Jan. '22, some of this divergence was actually started in December '21, which had it's correction in the end of January, but looks like it produced an even bigger divergent state.
The MACD is not only showing signal higher lows, but also showing counter divergence via histogram. The Storch RSI, RSI and CCI seem to be in synch for the most part with both RSI indicators showing camel humps of higher highs when in the middle of divergence phase when stock price arrived at newer lows, all the while having the CMF show no let up on producing new highs with counter divergence smack dap in the the end of the RSI correction, leaving me to think this pot stock may break into a new trend soon. I'm hesitant to jump in until it's confirmed, as this weekly chart shows an 'ABC' wave correction, which could turn into a squeeze that starts a new bull trend, it's had almost a month now to breakout into this new trend, leaving me to think shorts had prepared for this or has had a trick up their sleeve to control this wave up or lastly the last month was indeed the correction from what started in March (which was the correction from prior Dec.) -- I think this might be the case and we sell one more leg down, but not ruling out the possiblity. 9) Clever Leaves Holdings, Inc. ($CLVR)
Clever Leaves Holding Inc. ($CLVR) - August Divergence '22
Clever Leaves Holdings stock had a major 3rd - 4th wave correction end of March that rallied probably a little more than the shorts would of liked, and in doing so, trigging multiple divergences across all indicators.
All indicators are displaying almost in perfect synchronization the divergent state exactly when that March rally happened. Giving us higher highs on a chart showing lower lows, but only going $.01 cent lower than the previous $.91 low, showing a strong correction/reversal bull case. Watch the MACD zero-line and volume to increase while having the CMF also reach new high to show time to jump in. I believe we have time for another small sell off, but if support holds as it has it the past weeks, a easy 2x-3x is definitely in the realms and could also spark the cycle reversal and begin a 5 wave impulse going north. 10) Juva Life, Inc. ($JUVAF)
Jua Life Inc. ($JUVAF) - August Divergence '22
Juva Life might be a 'sleeping beauty' when it comes to divergent corrections and reversals. This pot stock chart shows another prior divergence state that started around Sept. '21 and March rally was the correction for that divergence, shown as counter divergences (hidden), highlighted on the CMF, CCI, and Storch RSI.
It looks like, as of Jan. '22, we might have entered another underlaying divergent state as the CMF, RSI and MACD have now showcased higher highs when the the stock price is experiences lower lows... Makes you wonder, eh? As other forecasted pot stocks, I believe we may have another sell off, but with this cannabis ticker being so close to cycle completion, we can only keep an eye on this marijuana stock to see if it breaks out and collects another 2x-3x correction that may turn into a reversal and bull inpulse. Honorable Mention: Ascend Wellness Holdings, Inc. ($AAWH)
Ascend Wellness Holdings Inc. ($AAWH) - August Divergence '22
Ascend Wellness looks like it has already made its' respectful correction, but could this be an actual "1-2" pivot into a bull impulse that changes the outlook on this pot stock?
While this MJ stock has yet to breakout into a new trend upwards, it has been riding the "no trespassing" sign for over a month and has not broken any of my wave theory rules, yet. With most indicators showing both regular and counter divergence, I have to wonder if there's going to be a continuous momentum that pushes this up more. CMF has yet to break stride since Feb. '21 and CCI register new highs over that same time while MACD histogram displaying higher highs during the CMF counter divergence. Marked on the chart as $3.45 - $4.22 as possible corrections if and when this wants to reverse, making this cannabis stock a honorable mention, watch for the MACD zero-line signal crossover with CMF still producing new highs to make higher bid volume for bull case. Conclusion
Since January ('22) I have stated that the week(s) of 8/08 - 8/15 will be telling how the sector reacts again. I have suspected a rally cover here for months and with bad past trends, one is easy to assume that the cannabis stocks sell off again after no November news of legalization. The past month of rallies don't convince me of an authentic bull case due to lack of volume.
So, are the shorts just covering because they want to play it safe just incase November does bring legalization? Possible, but if you know me, I don't like to talk about headlines... I can argue that some cannabis stocks on the week have not completed 1-5 waves, but rather are "ABC" compliant, until you look at the monthly and they are complete cycles. Could be an even battlefield now and we are just on the sidelines watching who's going to win (bulls or bears). Use your eyes, brain and gut for more confident trades... Oh, and watch out for divergence! Pot StocksWriting by Nick CaskeyPot Stocks provides stock chart technical analysis for cannabis investors in the marijuana sector of the stock market(s). Follow PotStocks420 on Twitter! Made or saved money by following these charts? Consider sending a tip or donate towards the analyst's pain management fund.
×
Available Tipping MethodsAvailable Tipping MethodsI just opened up a crypto account, not sure how it all works though... (click to copy to clipboard) Please send me a msg if you would like to tip other crypto. Message @NickolasCaskeyThank you so much in advance!Keep this joint in rotation, pass it along!
Comments
|


Clever Leaves Holding ($CLVR) chart is starting to look like a sherlock pipe ready to get packed, but first let's clear the dirty hits first before producing a new high...
01
Glass House Brands Inc, for the most part, has sustained relatively higher stock price action compared to their competition buds. Is this a paranoia high?
02
Green Thumb Industries Inc has been struggle to get high, despite having higher volume than most cannabis tickers. Will investors get high soon?
03
Curaleaf Holdings Corp. appears to be getting some investors high, but is this a high that will last long or will it become a buzz kill?
04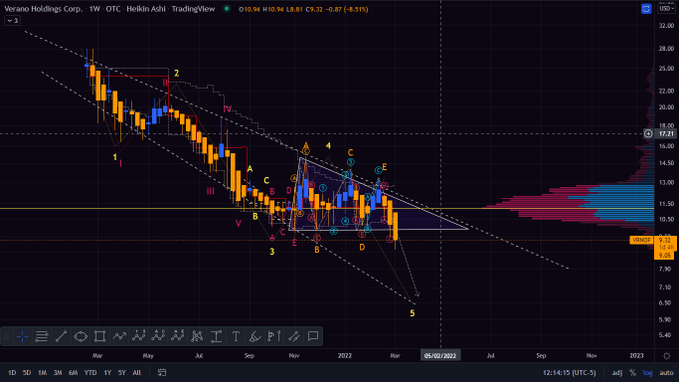
Verano Holdings Corp. has displayed some wacky-tobacky high and low price action, leavening investors in a cerebral haze, can the price soar high as a kite?
05
Columbia Care Inc, following the overall cannabis sector, has been displaying 'Reggie Miller type highs' leaving investors wondering if they will get a playoff buzz.
06
Disclaimer: The information and publications are not meant to be, and do not constitute, financial, investment, trading, or other types of advice or recommendations by Pot Stocks - These are theories and ideas using a chart analysis method developed by Nick Caskey.
 RSS Feed