! Announcement !
Due to the lack of interactions and tips, new chart posts will have less details to save time and efforts.
Please click on ads or leave a tip to help pay for awesome chart TA!?

I just opened up a crypto account, not sure how it all works though... (click to copy to clipboard)
Paypal: https://www.paypal.com/donate/?hosted_button_id=DJ59RG53BJY9E
Please send me a msg if you would like to tip other crypto.
Message @@NickolasCaskeyDue to the lack of interactions and tips, new chart posts will have less details to save time and efforts.
Please click on ads or leave a tip to help pay for awesome chart TA!?

Curaleaf Holding Inc ($CURLF) - Stock Chart Analysis [September, 2022]
Curaleaf ($CURLF): Buy or Sell?
Since July 14th, $CURLF has ran up +40% in their stock price. From the low of $4.79 to the high pivot of $6.75, now down -14% ($1). Curaleaf holdings stock price action maybe telling investors that more selling may occur for the start of September.
Quotes by TradingView

Curaleaf Holding Inc ($CURLF) - Daily Chart Analysis [September, 2022]
Curaleaf Stock Chart Analysis and Price Action Predictions
While since early summer, (June 22nd, 2022), if you take the low and run the volume profile up north to the peak, the POC is at a good, high $5.96-ish... and with the current price now at $5.91, not only did the pot stock unsuccessfully breakout the the channel's resistance, but the price action is now underneath the POC ("price/point of control").

Curaleaf Holding Inc ($CURLF) - Trading Indicator Divergence [September, 2022]
Curaleaf Stock Divergence
Now, let's take a gander at those nasty divergence states these indicators have displayed. First, the MACD (on top) shows a major discrepancy not only with the volume histogram, but also with the moving averages/signals. Also, the Storch RSI and the traditional RSI display high to low divergence pivots when the price action via candlesticks keep going up. Uh-Oh...

Curaleaf Holding Inc ($CURLF) - 4hr Chart and Indicator Divergence [September, 2022]
$CURLF Stock Divergence (4hr)
Curaleaf on the four hour timeframe seems to point towards now being the perfect time to collect on this divergence as the MACD signal lines are now falling below the zero-line while also showing less momentum in volume.
Curaleaf ($CURLF) ConclusionMight be a little too early to be 100% confident on this prediction and ending up striking out on this prediction. Just trying to turn that corner before the market does...
Again, while the POC is strong and the MACD on the daily still shows the moving averages above the zero-line, I still think this one will collect on the divergencies.
The current price target would hit $5.70-ish. This would be if the pullback is sweet and simple, giving you an 'ABC" pivot points and return to the north trend. But, I also think that this divergence may make it sink a little lower towards $5.52 and if some investors panic, $5.20 with a chance of getting down to $5.09. Pot StocksWriting by Nick CaskeyPot Stocks provides stock chart technical analysis for cannabis investors in the marijuana sector of the stock market(s). Follow PotStocks420 on Twitter! Made or saved money by following these charts? Consider sending a tip or donate towards the analyst's pain management fund.
×
Available Tipping MethodsAvailable Tipping MethodsI just opened up a crypto account, not sure how it all works though... (click to copy to clipboard) Please send me a msg if you would like to tip other crypto. Message @NickolasCaskeyThank you so much in advance!Keep this joint in rotation, pass it along!
Comments
|


Clever Leaves Holding ($CLVR) chart is starting to look like a sherlock pipe ready to get packed, but first let's clear the dirty hits first before producing a new high...
01
Glass House Brands Inc, for the most part, has sustained relatively higher stock price action compared to their competition buds. Is this a paranoia high?
02
Green Thumb Industries Inc has been struggle to get high, despite having higher volume than most cannabis tickers. Will investors get high soon?
03
Curaleaf Holdings Corp. appears to be getting some investors high, but is this a high that will last long or will it become a buzz kill?
04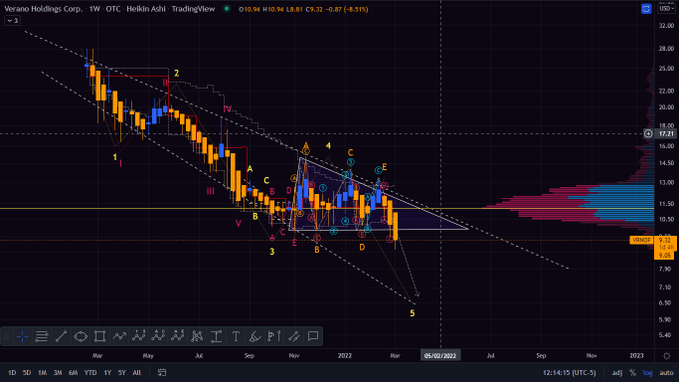
Verano Holdings Corp. has displayed some wacky-tobacky high and low price action, leavening investors in a cerebral haze, can the price soar high as a kite?
05
Columbia Care Inc, following the overall cannabis sector, has been displaying 'Reggie Miller type highs' leaving investors wondering if they will get a playoff buzz.
06
Disclaimer: The information and publications are not meant to be, and do not constitute, financial, investment, trading, or other types of advice or recommendations by Pot Stocks - These are theories and ideas using a chart analysis method developed by Nick Caskey.
 RSS Feed