! Announcement !
Due to the lack of interactions and tips, new chart posts will have less details to save time and efforts.
Please click on ads or leave a tip to help pay for awesome chart TA!?

I just opened up a crypto account, not sure how it all works though... (click to copy to clipboard)
Paypal: https://www.paypal.com/donate/?hosted_button_id=DJ59RG53BJY9E
Please send me a msg if you would like to tip other crypto.
Message @@NickolasCaskeyDue to the lack of interactions and tips, new chart posts will have less details to save time and efforts.
Please click on ads or leave a tip to help pay for awesome chart TA!?

$AYRWF CHART ANALYSIS
AYR Wellness seems to be following the overall cannabis index trend, but can this stock light up before the others?
Quotes by TradingView
On the weekly chart, $AYRWF looks to continue downwards, but gives little headroom for a '420 pump' as it closes out the primary cycle.
Current Buzz
On the weekly chart, Ayr Wellness looks to be almost wrapping up the 5th wave, which I believe will start around $8.11 and possible catch a ground about $7.42 following a cycle correction early/mid May. The MACD has been displaying divergence across all of the 4th to 5th wave, it will be interesting to see if the correction brings a corrected MACD .
The image below is on the daily and fresh off the press (as of March 23rd/updated). Since I made the market prediction (Twitter post below), it's been two weeks and although the stock price seems to behave nearly identical towards my technical analysis, I did notice how to correctly mark and modify calculations on the cycle pivots.

TAKE A HIT OR LET IT SIT?
$AYRWF Update
With most of the cannabis price action this past week, this cannabis ticker also sold a little more than expected.
This is also connected to TV not providing the chart data prior to the symbol change. So, along this chart analysis, I am running blind, but feel pretty good with this prediction with this timeframe now in align with other pot stocks. I know believe the markets want us to believe this has been over bought for most of the way down (looking at the volume profile , I guess that's true). With this chart, we'll see the summer correction that's needed (likely peak around $9.47 - $8.50 marker) and than start selling on the 5th wave down during Aug. This gives the ticker a chance in Oct. to have a time to correct the primary cycle. Pot StocksWriting by Nick CaskeyPot Stocks provides stock chart technical analysis for cannabis investors in the marijuana sector of the stock market(s). Follow PotStocks420 on Twitter! Made or saved money by following these charts? Consider sending a tip or donate towards the analyst's pain management fund.
×
Available Tipping MethodsAvailable Tipping MethodsI just opened up a crypto account, not sure how it all works though... (click to copy to clipboard) Please send me a msg if you would like to tip other crypto. Message @NickolasCaskeyThank you so much in advance!Keep this joint in rotation, pass it along!
Comments
|


Clever Leaves Holding ($CLVR) chart is starting to look like a sherlock pipe ready to get packed, but first let's clear the dirty hits first before producing a new high...
01
Glass House Brands Inc, for the most part, has sustained relatively higher stock price action compared to their competition buds. Is this a paranoia high?
02
Green Thumb Industries Inc has been struggle to get high, despite having higher volume than most cannabis tickers. Will investors get high soon?
03
Curaleaf Holdings Corp. appears to be getting some investors high, but is this a high that will last long or will it become a buzz kill?
04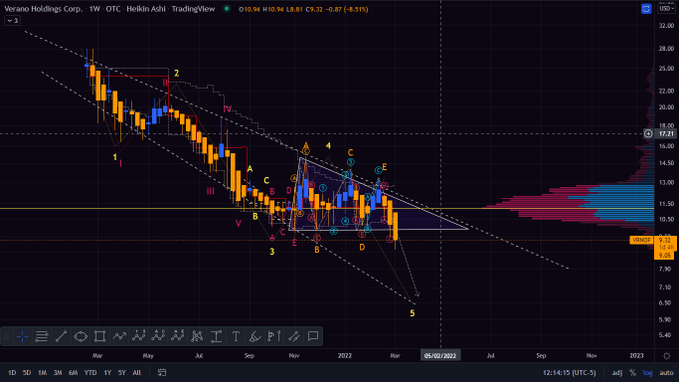
Verano Holdings Corp. has displayed some wacky-tobacky high and low price action, leavening investors in a cerebral haze, can the price soar high as a kite?
05
Columbia Care Inc, following the overall cannabis sector, has been displaying 'Reggie Miller type highs' leaving investors wondering if they will get a playoff buzz.
06
Disclaimer: The information and publications are not meant to be, and do not constitute, financial, investment, trading, or other types of advice or recommendations by Pot Stocks - These are theories and ideas using a chart analysis method developed by Nick Caskey.

 RSS Feed