! Announcement !
Due to the lack of interactions and tips, new chart posts will have less details to save time and efforts.
Please click on ads or leave a tip to help pay for awesome chart TA!?

I just opened up a crypto account, not sure how it all works though... (click to copy to clipboard)
Paypal: https://www.paypal.com/donate/?hosted_button_id=DJ59RG53BJY9E
Please send me a msg if you would like to tip other crypto.
Message @@NickolasCaskeyDue to the lack of interactions and tips, new chart posts will have less details to save time and efforts.
Please click on ads or leave a tip to help pay for awesome chart TA!?

AdvisorShares Pure US Cannabis ETF Chart Trend - September 2022
AdvisorShares Pure US Cannabis ETF ($MSOS) September - Buy or Sell?
Pot Stocks appear to be on a rally since end of June and going through July and August. As predicted August proved to be the pivot timeframe needed to pullback, but is this pullback actually a cycle correction? To gauge the MSOS marijuana stock price prediction, let's take a look in more detail.
Quotes by TradingView
MSOS Monthly Chart Analysis
AdvisorShares Pure US Cannabis ETF Monthly Chart Trend - September 2022
Short and simple; If we look at $MSOS cannabis ETF ticker on the monthly timeframe, this is how I would draw it up. It makes sense this correction is extended from the previous short, "ABC" prior pullback.
MSOS Weekly Chart Analysis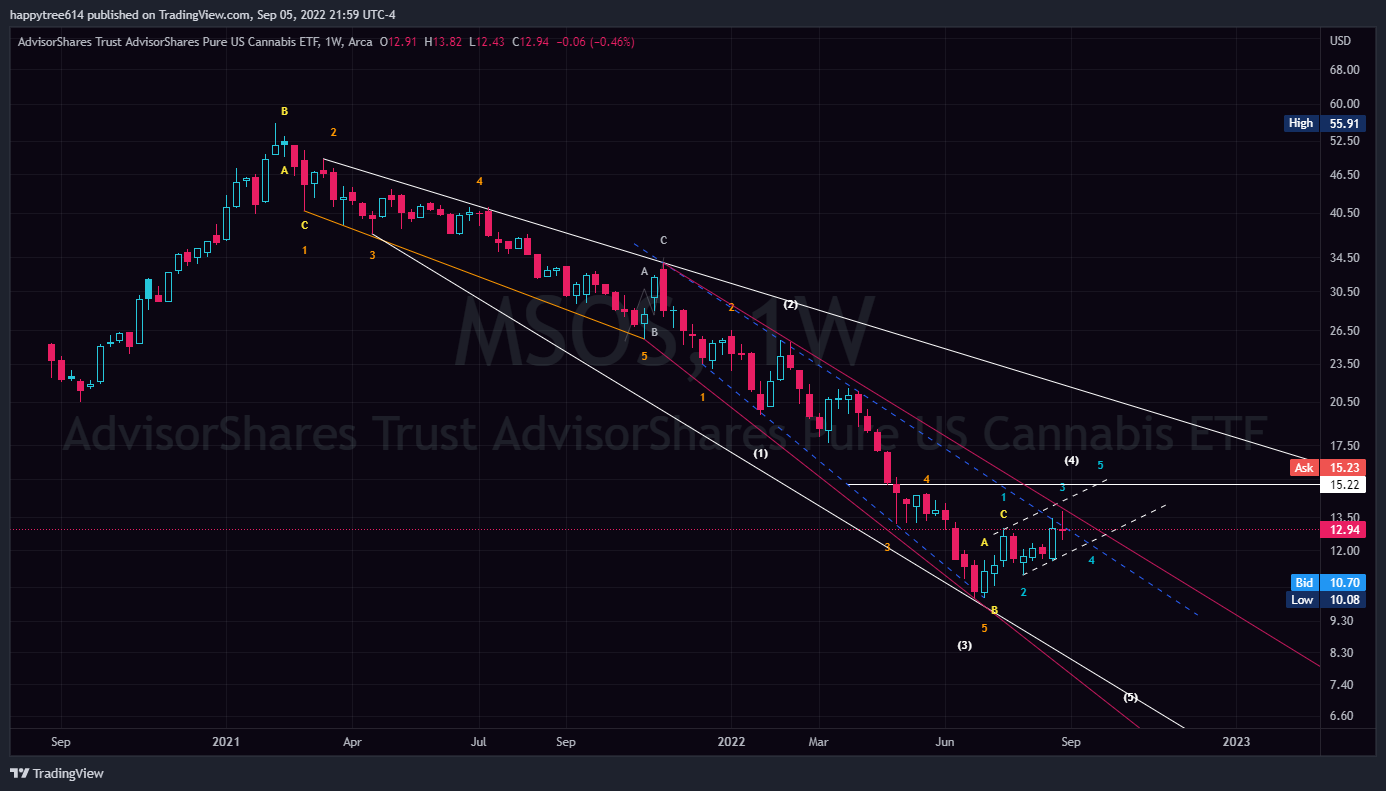
AdvisorShares Pure US Cannabis ETF Weekly Chart Trend - Pullback - September 2022
The chart on a weekly timeframe suggests the same as the monthly, as the first sell off pullback formed a triangle and used an "ABCDE" wave for the bear impulse to take over and briefly giving us an "ABC" pullback after the first impulse correction. This makes sense, again using the alternative pullback here ("12345"). Making its price target around $15.22. But this will get us out of the prior trend threshold, so what can we expect afterwards?
MSOS Weekly Chart Analysis = Bullish?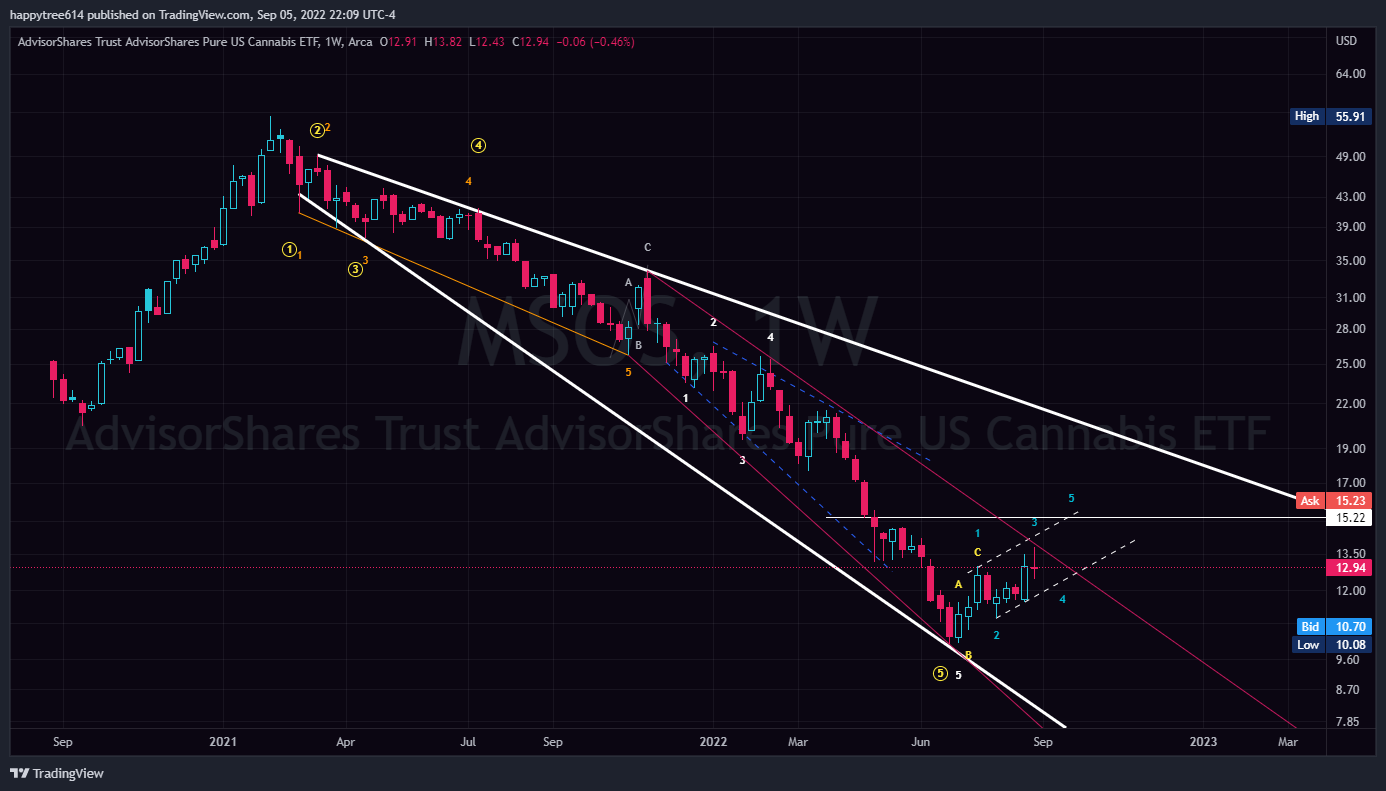
AdvisorShares Pure US Cannabis ETF Weekly Chart Trend - Pullback - September 2022
Once could make the argument that this pot stock has already made its bearish impulse waves (circled '12345') and this is the cycle correction. Which will eventually end up in the same pivot position as previous chart (above). But this time it shows an open field of new highs to reach before meeting prior thresholds on the cycle starting out.
MSOS Weekly Chart Analysis = Bullish Continuation
AdvisorShares Pure US Cannabis ETF Weekly Chart Bullish Trend - September 2022
Now, we take the same chart as before and we turn on the volume profile. There is a big gap separating and it already shows us under POC, making our return currently. So, have we technically been overbought this long way down and now, since end of June, making our correction towards POC (being oversold in July)? If so, I would expect to make a pivot around $16.49 and start using the short resistance and new bull support.
MSOS Daily Chart Analysis = Bullish Outcome
AdvisorShares Pure US Cannabis ETF Daily Chart Trend - September 2022
Let's turn that weekly timeframe into a daily and examine this bullish outcome. By doing so, we see that a wedge channel is forming, and it is totally possible to hit all of those bullish price targets, which ends up in new territory. If MSOS can touch $16.50 and still have $12.22-ish hold as new support, I would say we have ourselves a bull impulse wave and this would prove to be a cycle correction.
MSOS Daily Chart Analysis = Bearish Outcome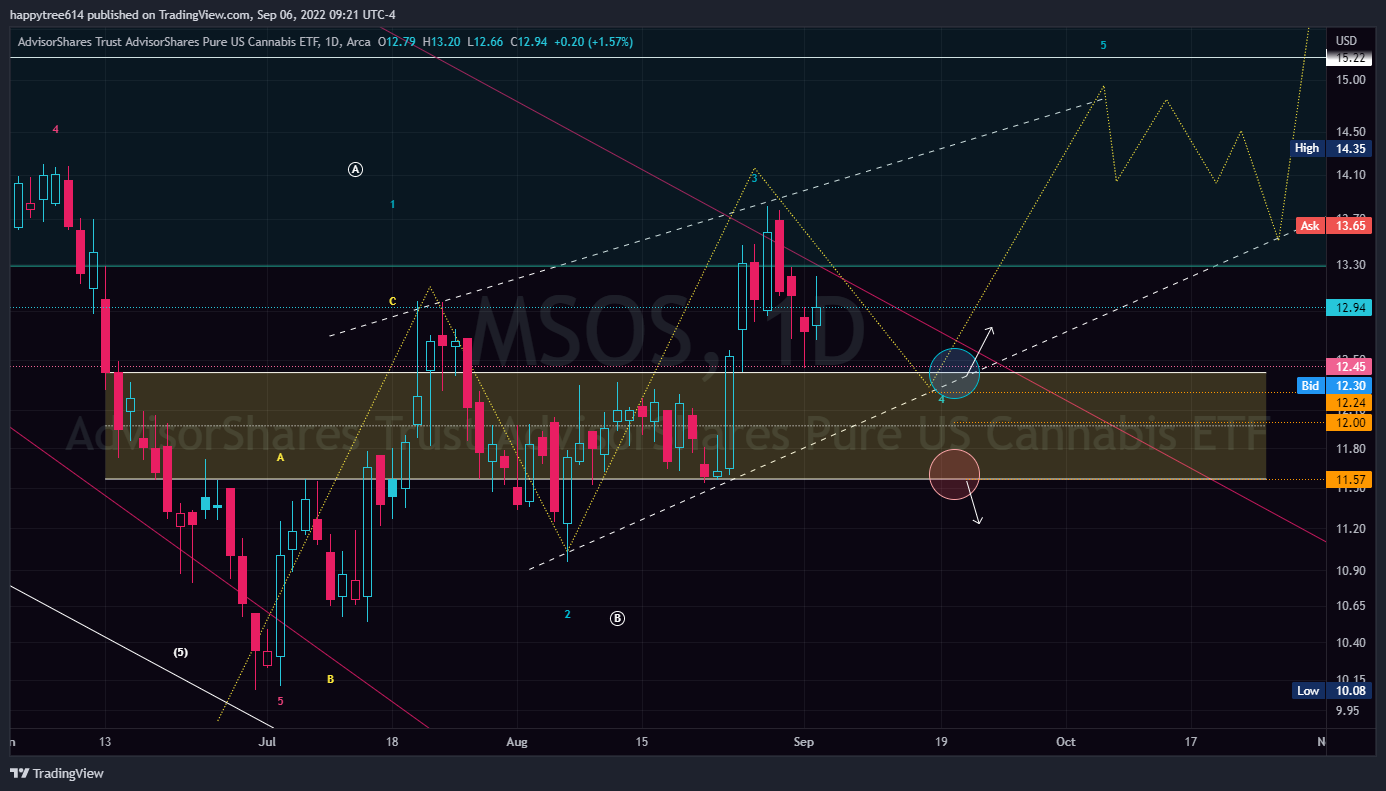
AdvisorShares Pure US Cannabis ETF Chart Daily Trend - Bearish Outcome - September 2022
Watch the level of support and the volume input when these support and resistance areas come into play. I will be watching if $12.20-ish holds for a strong bullish pivot, $12.00 being a close call, but if bids are in place than it still might have a chance of following bulltrend.
On the other hand, if we see MSOS close below $12 and makes its way underneath $11.57, shorts will appear to have the better position and could sink this and other pot stocks down to retest and quite possibly sell off to new lows. Pot StocksWriting by Nick CaskeyPot Stocks provides stock chart technical analysis for cannabis investors in the marijuana sector of the stock market(s). Follow PotStocks420 on Twitter! Made or saved money by following these charts? Consider sending a tip or donate towards the analyst's pain management fund.
×
Available Tipping MethodsAvailable Tipping MethodsI just opened up a crypto account, not sure how it all works though... (click to copy to clipboard) Please send me a msg if you would like to tip other crypto. Message @NickolasCaskeyThank you so much in advance!Keep this joint in rotation, pass it along!
Comments
|


Clever Leaves Holding ($CLVR) chart is starting to look like a sherlock pipe ready to get packed, but first let's clear the dirty hits first before producing a new high...
01
Glass House Brands Inc, for the most part, has sustained relatively higher stock price action compared to their competition buds. Is this a paranoia high?
02
Green Thumb Industries Inc has been struggle to get high, despite having higher volume than most cannabis tickers. Will investors get high soon?
03
Curaleaf Holdings Corp. appears to be getting some investors high, but is this a high that will last long or will it become a buzz kill?
04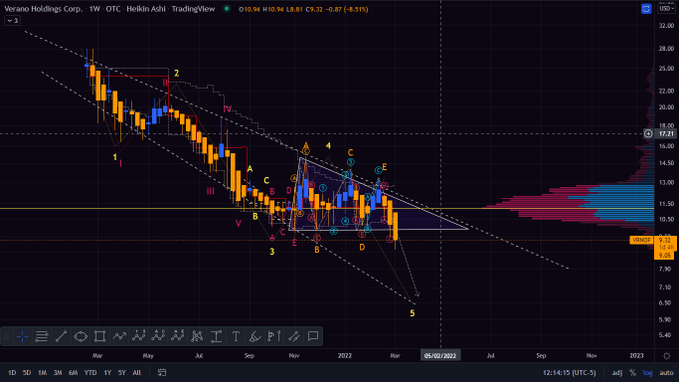
Verano Holdings Corp. has displayed some wacky-tobacky high and low price action, leavening investors in a cerebral haze, can the price soar high as a kite?
05
Columbia Care Inc, following the overall cannabis sector, has been displaying 'Reggie Miller type highs' leaving investors wondering if they will get a playoff buzz.
06
Disclaimer: The information and publications are not meant to be, and do not constitute, financial, investment, trading, or other types of advice or recommendations by Pot Stocks - These are theories and ideas using a chart analysis method developed by Nick Caskey.
 RSS Feed